Affinity theme mapping services

Affinity mapping is a collaborative method used to group large volumes of data into meaningful themes. Affinity maps help identify patterns, surface insights, and support better decision-making at multiple stages of the design process.

Making sense of complex qualitative data

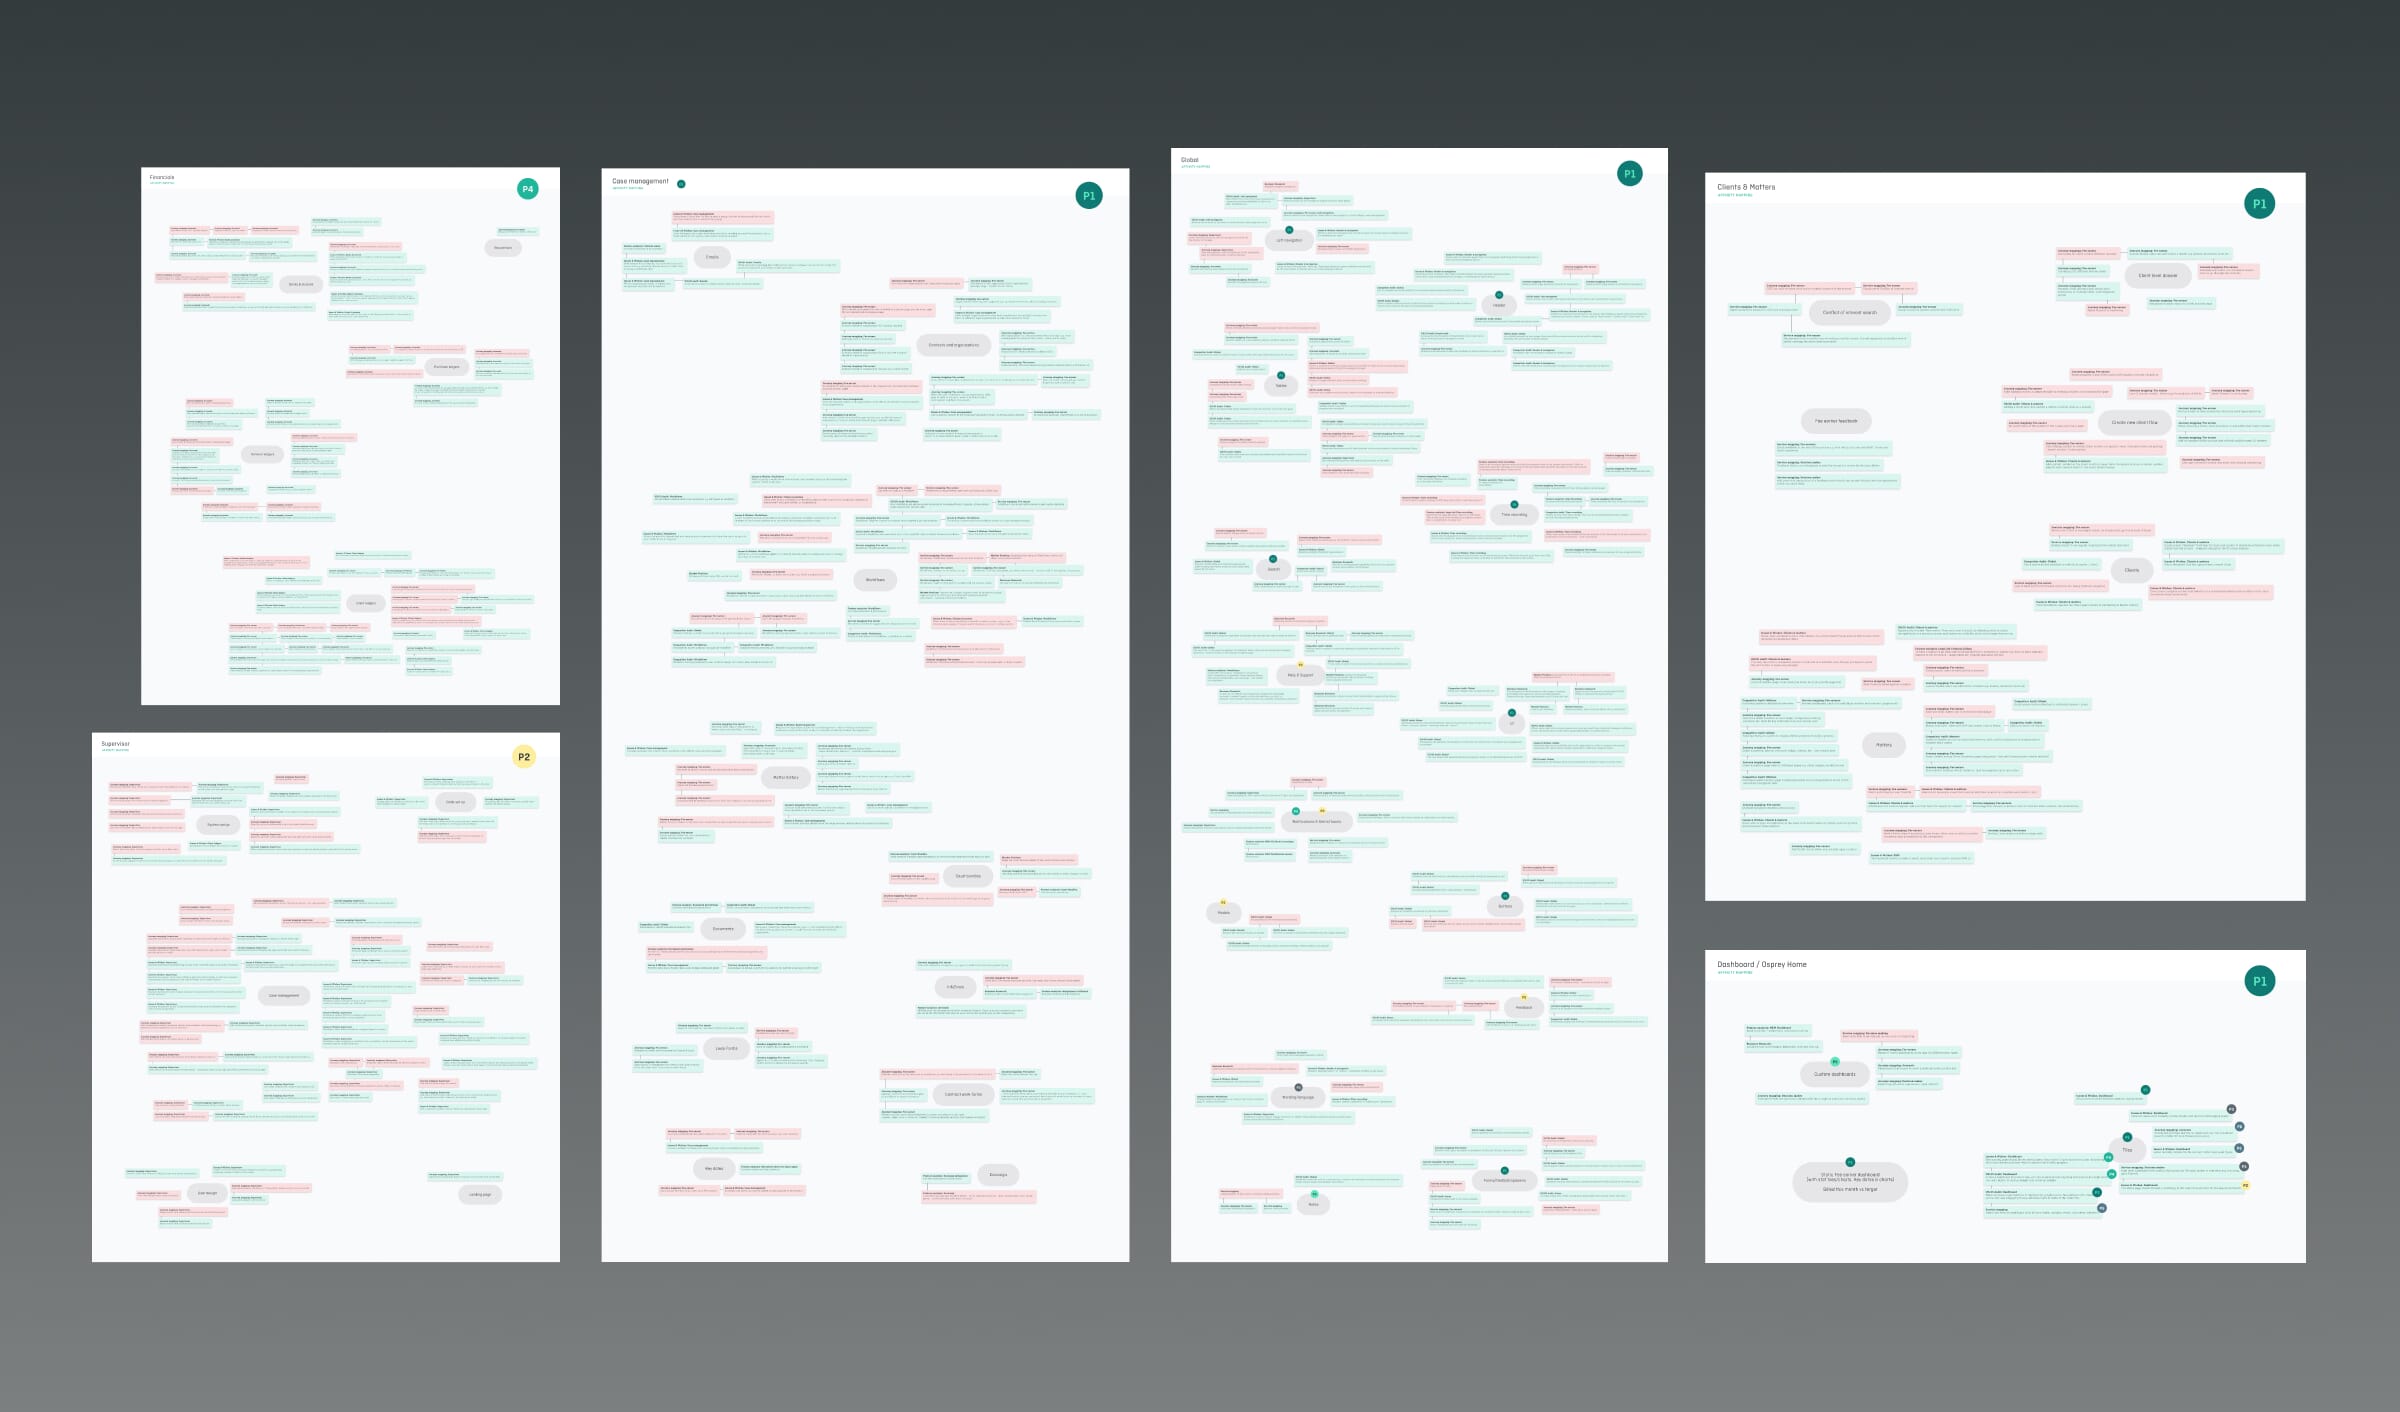
Affinity mapping/diagramming is especially useful during concept validation and after research activities, when large amounts of qualitative data need to be reviewed and structured. It allows teams to work through user interview transcripts, field notes, feedback logs, or brainstorming outputs to identify themes and areas of focus.

We use affinity diagramming when there is a need to:

  • Turn individual observations into clear themes
  • Create shared understanding across disciplines
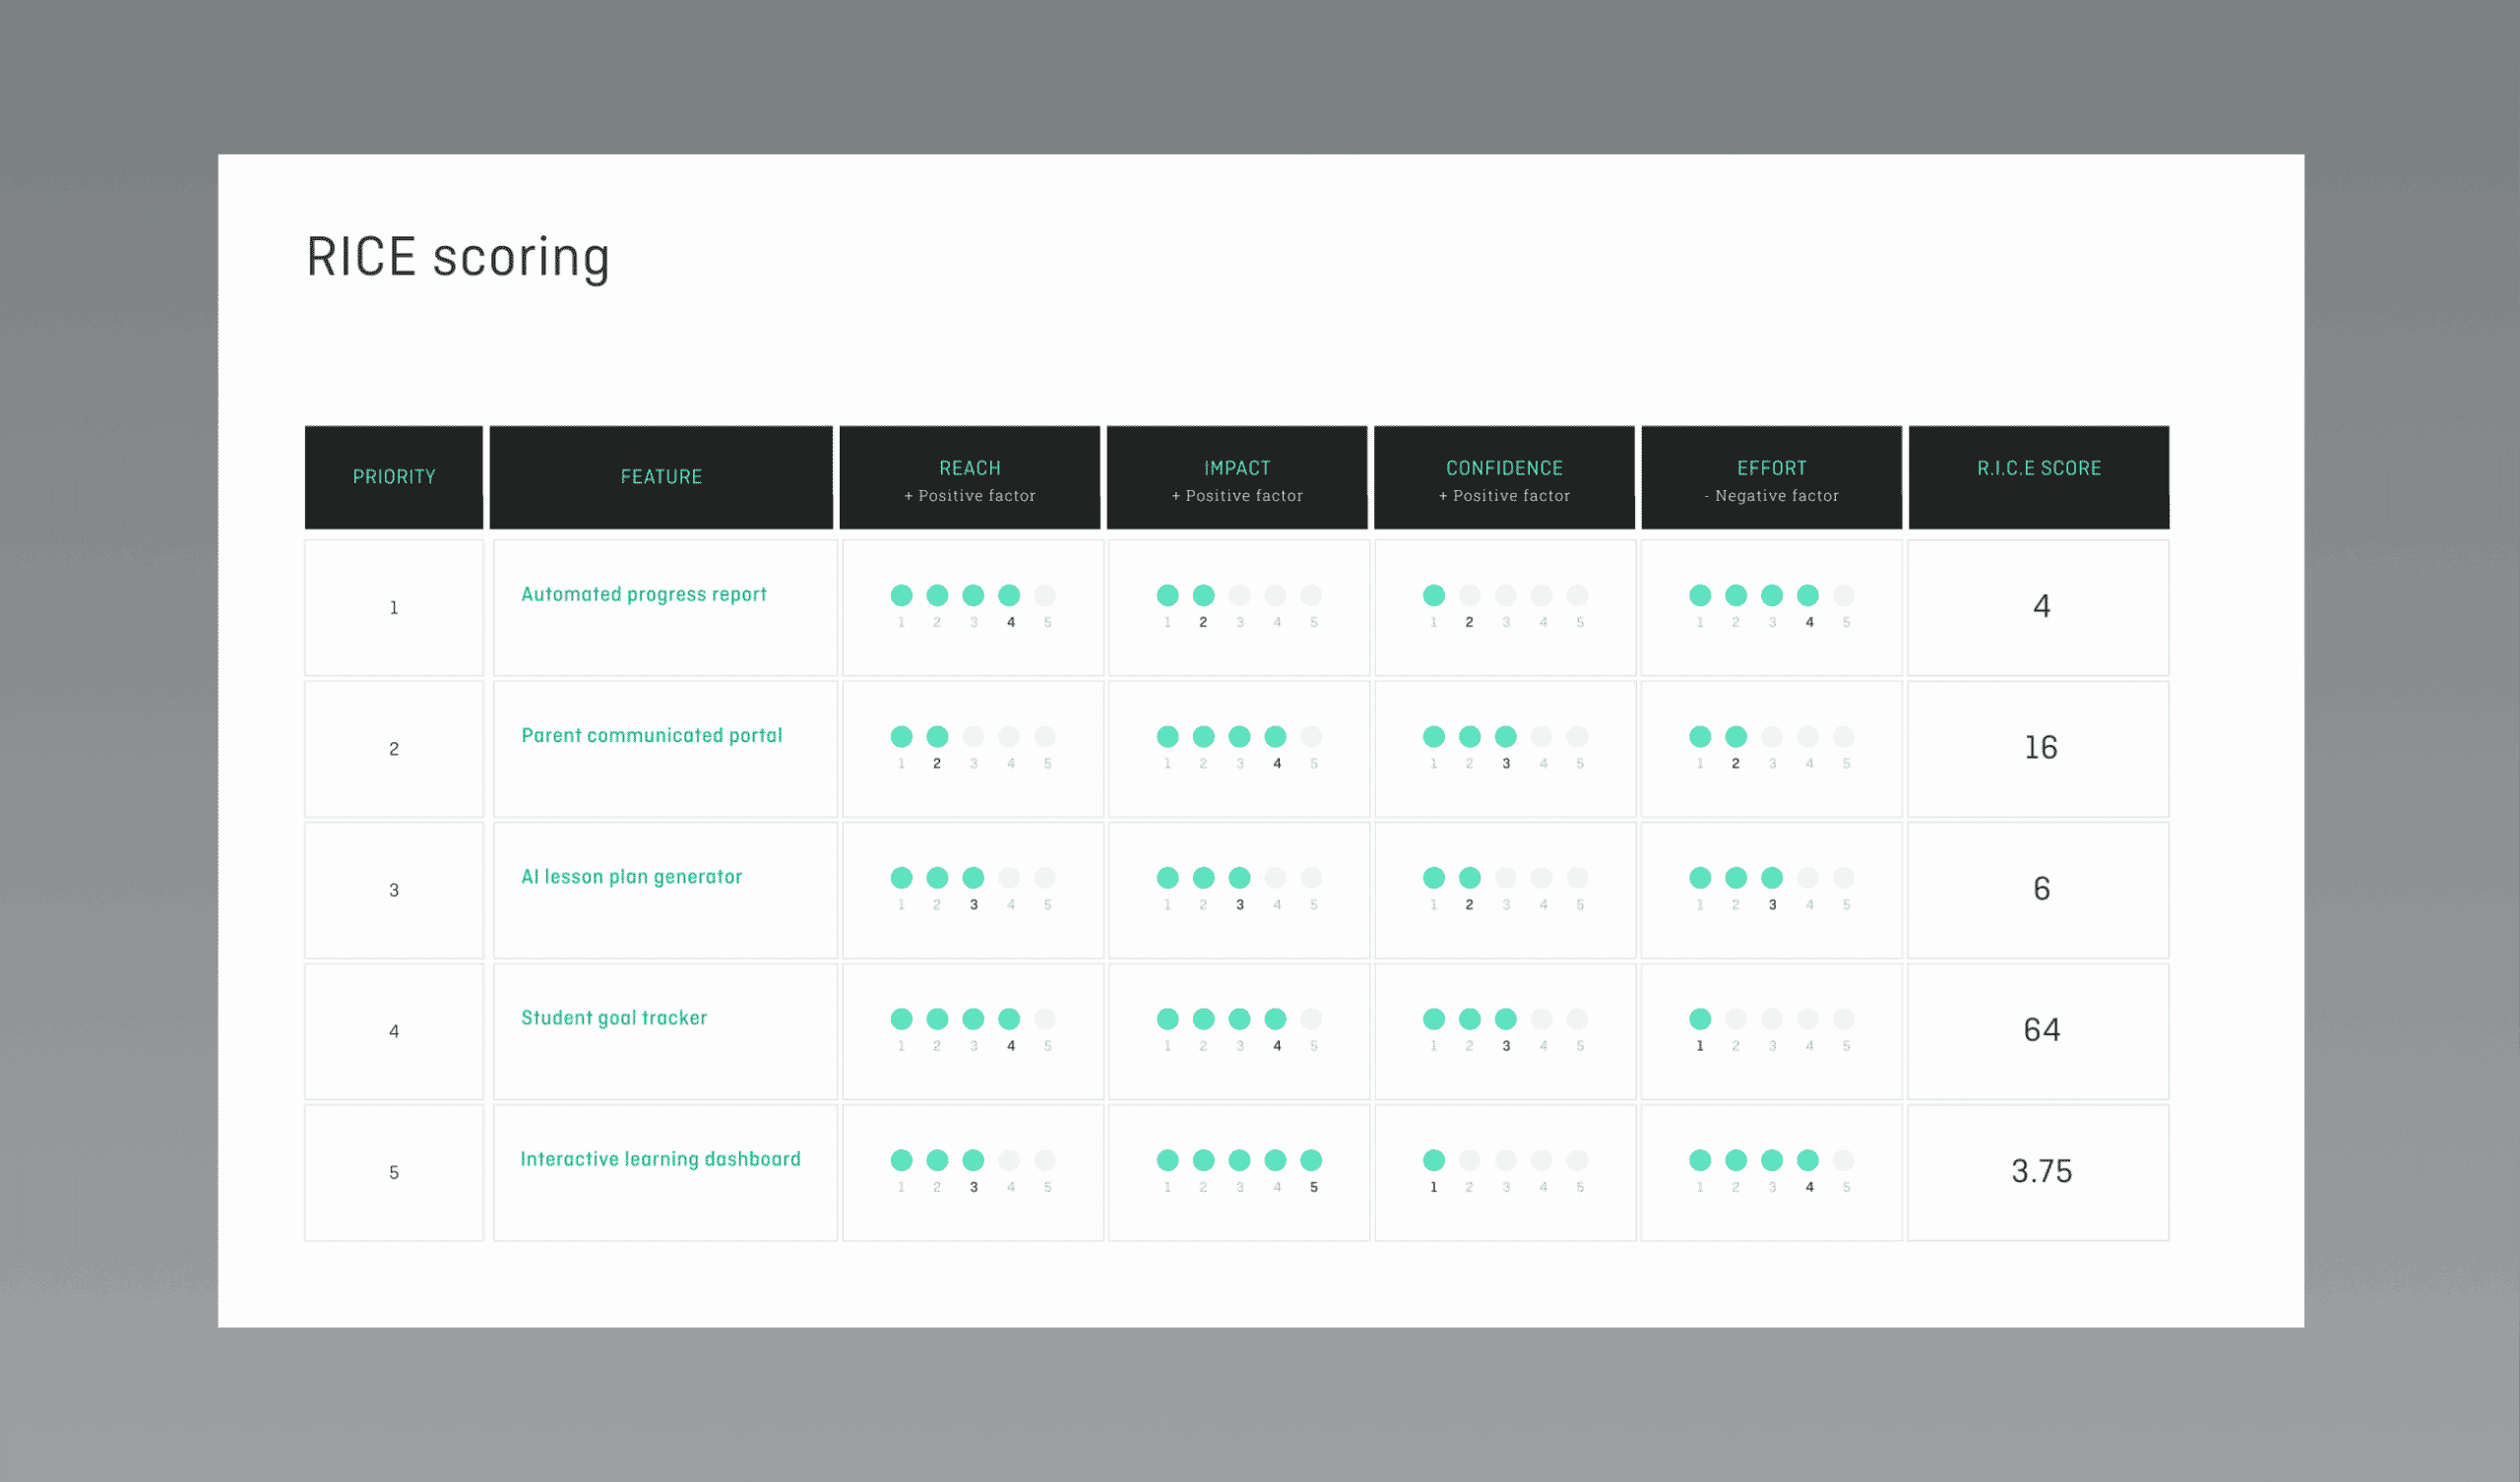
  • Focus decision-making on what matters most

It can be used to resolve challenges such as:

  • Information overload, by breaking down large volumes of notes into manageable groups
  • Lack of clarity, by helping teams see how individual points relate to broader themes
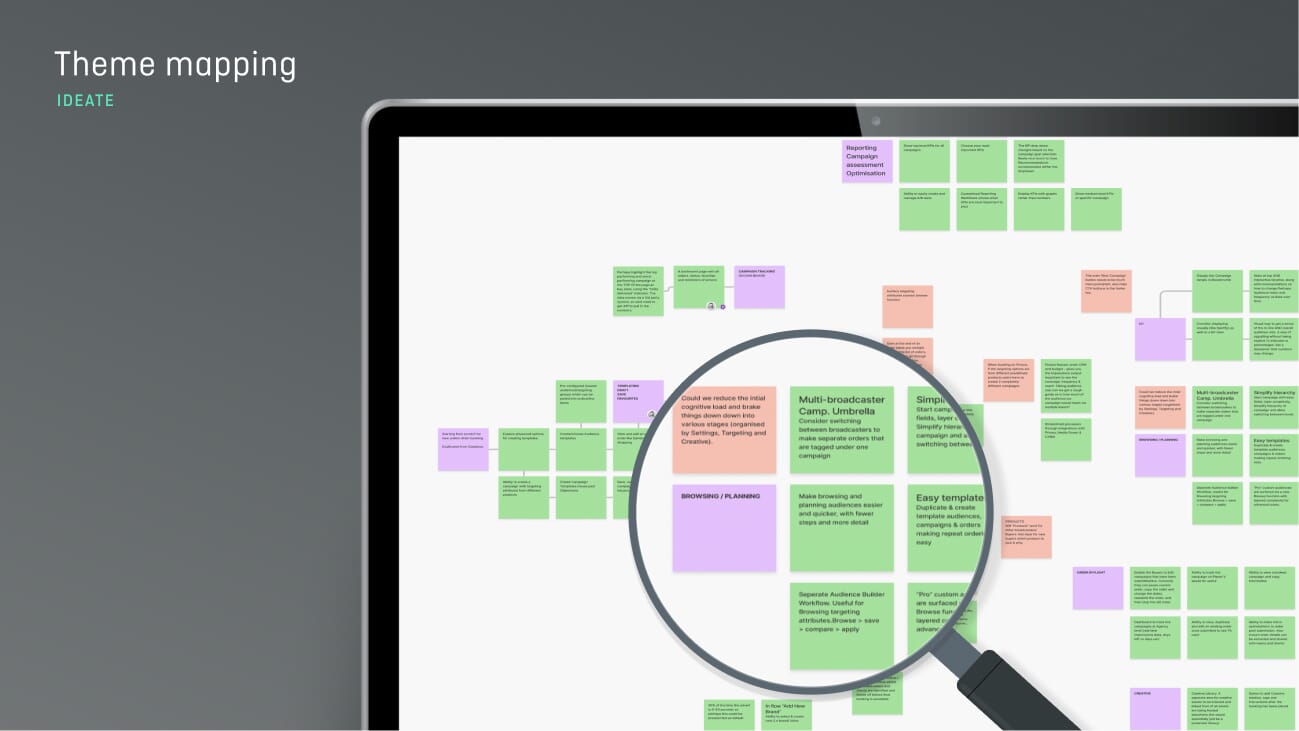
  • Unstructured ideation, by providing a way to cluster ideas generated during workshops
  • Hidden trends, by revealing repeated issues, pain points or behaviours in UX research data

Affinity mapping acts as a bridge between the raw, qualitative data you often receive when conducting user research, and meaningful insight.


Collaborative sensemaking

A typical affinity diagramming session has two main stages.

  1. Grouping related items

We begin by collecting all relevant information, usually in the form of digital cards. Each card should represent a single observation, idea, or quote. These are then reviewed and loosely grouped based on similarity. At this stage, we avoid forcing categories too early and instead allow themes to emerge naturally.

Once clusters begin to form, they are reviewed and refined. Similar cards are moved together, duplicates are removed, and tentative group labels are added to reflect the core topic of each cluster.

This stage can feel messy, but it is intentionally open-ended to support a wide range of perspectives and ideas.

  1. Reviewing and clarifying the themes

Once the initial clusters of sticky notes are in place, we move into a more critical review. This involves asking questions like:

  • Are these groups clearly distinct from one another?
  • Are all the cards in the right place?
  • Are any groups too broad or too narrow?
  • Can any clusters be combined or simplified?

We encourage teams to consolidate wherever possible. By reducing unnecessary duplication and trimming overly detailed clusters. This way, the final result becomes sharper and easier to use. However, if a theme or idea recurs across multiple users or stakeholders, that repetition can be significant. In these cases, rather than removing it, we note its frequency, for example, by numbering the card to reflect its weight in decision-making. The aim is not just to group things for the sake of it, but to extract clear insights that will guide what happens next.

At the end of this process, we’re left with a structured set of themes that reflect the most important findings. These can then inform next steps, whether that’s creating user journey maps, prioritising features, or planning further UX research.

From data to action

Affinity diagrams helps teams to build a shared understanding of what the data really says and creates space for informed, confident decision-making. This method works equally well for teams working remotely or in person, and it scales well for both small and large research efforts.

The value lies in how it translates complexity into clarity when followed up with other strategies and activities, such as more precise customer surveys, user interviews and rapid prototyping, based on the feedback gathered in the exercise. Stakeholders can see how insights were formed, where they came from, and how they connect to the broader problem space.


Typical outcomes include:

  • A clear set of labelled themes that summarise research findings
  • A shared understanding of user pain points, behaviours, or motivations
  • Identified gaps or opportunities to explore further
  • A structured foundation for ideation or prioritisation workshops
  • Greater team alignment on next steps

Used well, affinity diagrams can help support a focused, evidence-based design process and helps ensure that future decisions are grounded in real insight rather than assumption.


FAQs

When should we use affinity mapping in a project?

Affinity maps work best when you have a large volume of research data, ideas, or feedback that needs to be organised into meaningful themes. Affinity diagrams are often used after UX research to identify patterns and guide the next steps in the design process.


How does affinity diagramming help improve the design process?

By clustering related insights and identifying key themes, affinity maps make it easier to spot opportunities, reduce complexity, and prioritise ideas. This ensures your design decisions are based on evidence rather than assumption.


Can affinity mapping be done remotely?

Yes. While many teams use physical sticky notes in person, online tools like Miro or Figma make it easy to run collaborative affinity mapping sessions remotely on virtual boards with the same benefits.


What is the outcome of an affinity diagramming session?

You’ll leave with a clear visual grouping of themes, distilled key insights, and a prioritised focus for your next project stage, helping everyone work toward shared goals.


Book a virtual coffee

Speak directly with our founders Ed and Jon about how we can help you on your Innovation or Transformation project.

Contact
Ed & Jon

Contact details

Find us

Cheyenne House
West Street
Farnham, Surrey
GU9 7EQ

Cheyenne House
West Street
Farnham, Surrey
GU9 7EQ

Contact form

Looking for a long term partner to support your business?

By browsing our website you agree to our cookie policy. You can opt-out anytime from our cookies page